In this new tutorial series, Make the Chart, you’ll walk through the steps to remake a specific visualization that I made from start to finish: data, analysis, code, and editing. Download the data and source material. Apply it to your own work.
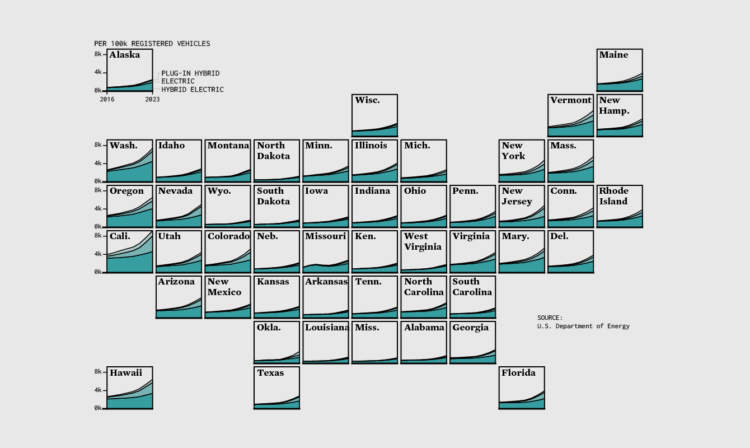
In this first tutorial, you’ll remake a grid map with stacked area charts. I hope you find it helpful.
Become a member for access to this — plus tutorials, courses, and guides.